ARC provides new resources to document COVID-19 spread
Published 1:00 pm Friday, March 27, 2020
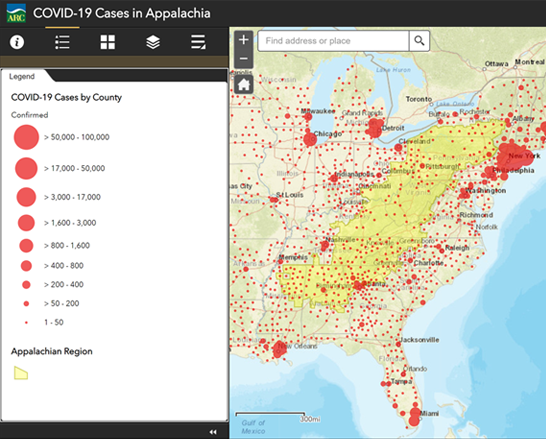
Photo courtesy of the ARC
The COVID-19 Cases in Appalachia Map displays the current number of confirmed cases of COVID-19 in the region and throughout the country by marking higher number of confirmed cases with larger dots and lower numbers with smaller dots. The map is automatically updated throughout the day and can be found at arc.gov/coronavirus
|
Getting your Trinity Audio player ready...
|
WASHINGTON, D.C. — The Appalachian Regional Commission (ARC) recently announced two new tools documenting the spread of COVID-19 at the regional and county levels.
The first tool, the COVID-19 Cases in Appalachia Map, displays the current number of confirmed cases of COVID-19 in Appalachia and throughout the United States.
Higher numbers of cases are marked by larger dots, while lower numbers of confirmed cases are represented by smaller dots. By clicking on a location, users can also see confirmed COVID-19 cases, and any related deaths, at the county level.
This map is automatically updated throughout the day by drawing on data collected by the Johns Hopkins University. As of March 26th, at 1:30 pm (ET), there were 1,686 confirmed COVID-19 cases across 208 Appalachian counties.
The second tool, Explore County-level Coronavirus Impact Planning searchable database, presents a demographic data snapshot of confirmed COVID-19 cases and deaths in relation to hospital bed counts, population and businesses and categories of people at risk for COVID-19 in infographic form for each one of the nation’s counties. By clicking on each statistical icon, users can learn more about the supporting data. COVID-19 related data is updated daily.
These tools were developed in cooperation with ESRI, who is currently providing the data free of charge for open source use purposes.
“These comprehensive resources can serve as an important tool for policy-makers and all those involved in the response to COVID-19 in the Appalachian Region,” said ARC Federal Co-Chairman Tim Thomas. “This unique challenge requires an innovative response, and I am thankful to the researchers and modelers who have risen to the occasion to develop these valuable tools.”
These tools, as well as other ARC updates in regards to the COVID-19 pandemic, are available at arc.gov/coronavirus.